
The last time California became an inland sea, the state’s governor was stranded in Sacramento and had to be ferried to his own inauguration by rowboat. That was January 1862. The storms that produced it lasted 43 days. They turned the entire Central Valley into a body of water nearly 300 miles long, swallowed towns whole, and drowned an estimated quarter of the state’s cattle population. By the geological record, California has experienced megastorms in the years 212, 440, 603, 1029, roughly 1300, 1418, 1605, 1750, 1810, and most recently 1861 to 1862, giving a historic recurrence of, on average, every 100 to 200 years.
By that rhythm, another one is overdue. But that’s not actually the problem. The problem is that climate change has quietly moved the clock forward, and the infrastructure protecting tens of millions of people was built with the old schedule in mind.
That gap between what the science now predicts and what cities, dams, and levees were actually designed to handle is where the real story of mega-flood prediction lives. It’s not just a California story, either. From Bangladesh to Germany to the river deltas of West Africa, the numbers scientists use to build flood defenses are turning out to be wrong in the same direction: too low, too slow, too far behind the curve.
The Clock Has Been Moved Forward
A 2022 study published in Science Advances found that climate change has already doubled the likelihood of an event capable of producing catastrophic flooding in California. That study, known as ARkStorm 2.0, modeled the “plausible worst-case scenario” for California flooding using a combination of climate model data and high-resolution weather modeling. The name itself is a clue to the scale: ARkStorm is short for Atmospheric River 1,000-year Storm, the kind of event that was once considered a once-in-a-millennium outlier.
What that doubling translates to in practical terms is that a 200-year flood event is now more likely to happen once in 100 years, and with continued warming, it could become a once-in-50-year flood event. “That’s a profound difference with just a few degrees of warming,” said UCLA climate scientist Daniel Swain.
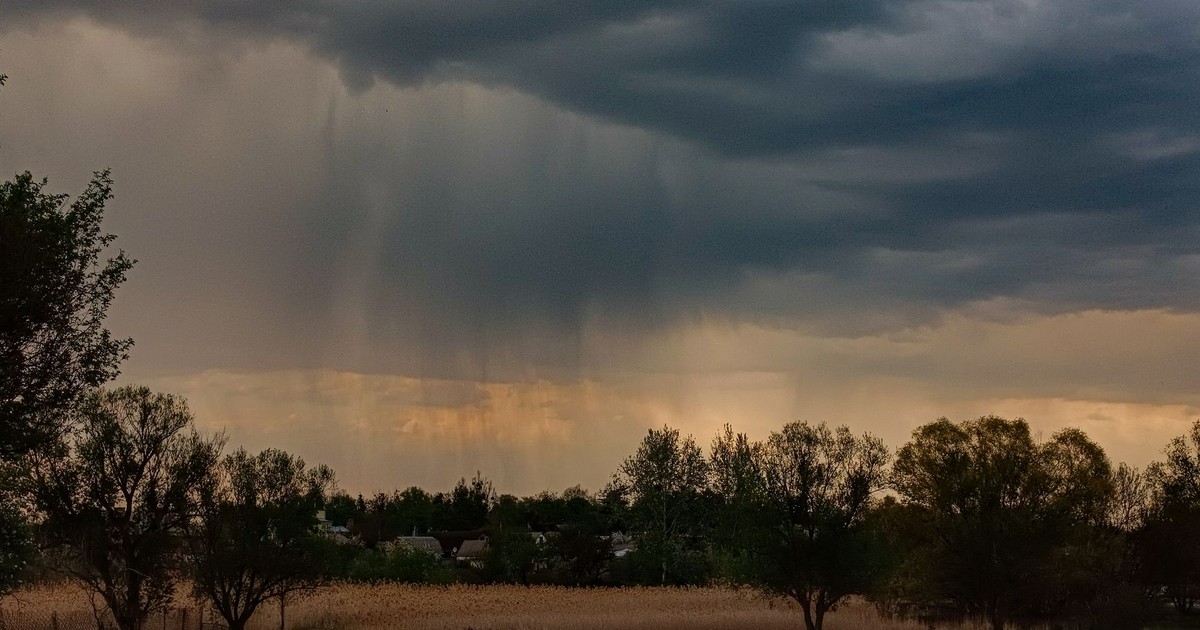
The process driving this isn’t complicated, even if its consequences are staggering. On average, for every 1 degree Celsius the atmosphere warms, it can hold 7 percent more water vapor. When atmospheric processes do trigger rain, that extra background moisture can make it rain more heavily, leading to increased flooding. Think of the atmosphere as a sponge that grows larger with every increment of warming. The storms themselves don’t necessarily get more frequent. They just carry more. And when they land on a landscape already shaped by drought, wildfire, and the rapid shift from snow to rain in mountainous areas, the results are extreme.
The ARkStorm 2.0 research found that runoff in a future extreme storm scenario would be 200 to 400 percent greater than historical values in the Sierra Nevada, because of increased precipitation rates and decreased snow fraction. In other words, what used to fall as snowpack and slowly release into rivers over months would now arrive all at once as rain, with nowhere to go but downstream. The warning signs of natural phenomena that scientists track, from river temperature shifts to sudden changes in creek levels, only carry meaning if the underlying risk models keep pace with what the climate is now capable of producing.
What the 100-Year Flood Label Actually Means
Buried in the technical language of flood engineering is a number that shapes almost every decision about where to build, what to insure, and how high to construct a levee. Infrastructure such as dams, levees, and barriers is built for 100-, 500-, or 1,000-year events, meaning events with a 1 percent, 0.5 percent, or 0.1 percent chance of recurrence in any given year respectively. Most infrastructure is designed for 100-year events.
The problem is that those calculations are rooted in historical data. “The assumption is that historical trends will continue into the future. With climate change, that assumption doesn’t hold,” said Djordje Mitrovic Mustafa, a flood expert quoted in Al Jazeera’s end-of-2025 flood review. The entire engineering framework assumes a stable climate. The climate is no longer stable.
Since the inception of the National Flood Mapping Program in 1967, only about one-third of the nation’s streams, rivers, and coastlines have been mapped by FEMA, and only one-quarter of those models have been updated in the past five years. Numerous communities throughout the U.S. haven’t been mapped for decades, and some of the most outdated maps reflect the nation’s most flood-prone areas.
The NRDC notes that FEMA only maps the 100-year floodplain with 50th percentile confidence, meaning there is only a 50 percent chance that a 100-year flood will fall inside the line FEMA draws on its maps. That is a coin flip. Heads, the flood stays within the designated zone. Tails, it doesn’t. And that calculus was developed before a warming atmosphere added extra weight to the tails side.
The Regions With the Most to Lose
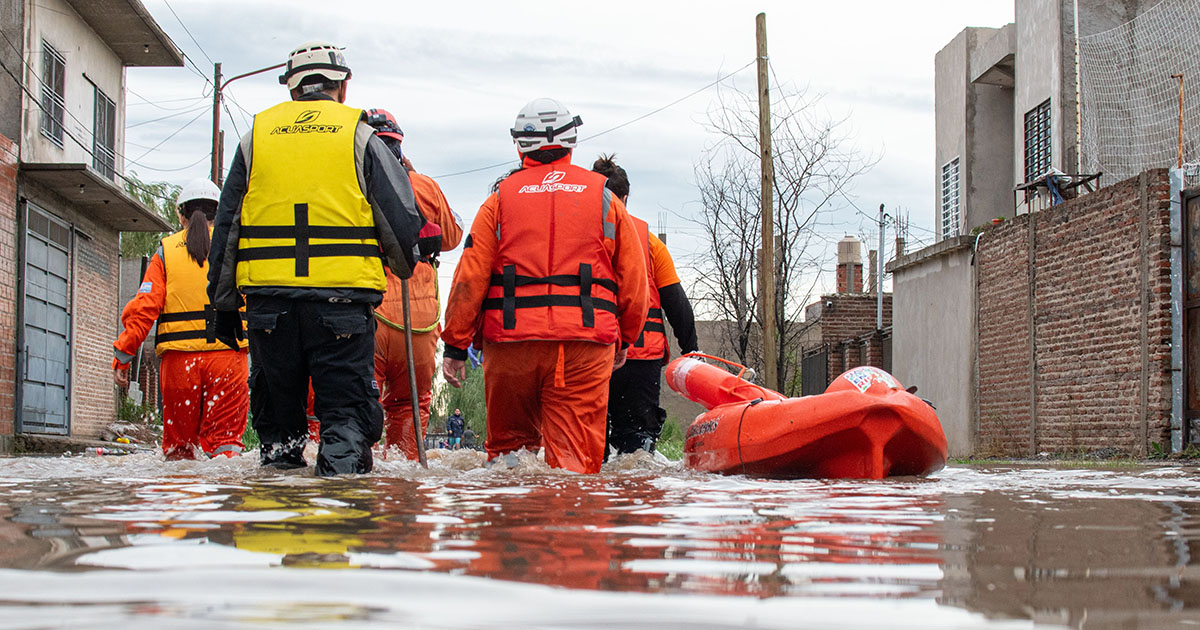
California tends to dominate the conversation about mega-flood prediction, partly because the ARkStorm research is so thoroughly documented, and partly because the economic stakes are almost incomprehensible. A severe California winter storm could realistically flood thousands of square miles of urban and agricultural land, result in thousands of landslides, disrupt lifelines throughout the state for days or weeks, and cost on the order of $725 billion – more than three times the estimated cost of a major ShakeOut earthquake scenario, which has roughly the same annual occurrence probability.
Unlike an earthquake, though, an ARkStorm-scale event would lead to catastrophe across a much larger area. “Every major population center in California would get hit at once – probably parts of Nevada and other adjacent states, too,” Swain said. And critically, the first ARkStorm exercise concluded that it would not be possible to evacuate the 5 to 10 million people who would be displaced by floodwaters, even with weeks of notice from meteorologists and climatologists.
But California is one node in a global pattern. Global mapping of compound flood risk published in Communications Earth & Environment in January 2026 shows that high-risk areas are largely concentrated in major low-lying, densely populated river deltas, including the Ganges, Pearl, Niger, Mississippi, and Rhine. Asia accounts for the largest share of high-risk areas at 35 percent, followed by Africa at 20 percent, Europe at 17 percent, and North America at just over 2 percent. At the subnational level, the highest concentrations of risk cluster in Southeast Asia, including Bangladesh, Vietnam, Thailand, China, India, Japan, and North Korea.
In Bangladesh, more than half the population – nearly 58 percent of residents – live in areas at danger of being affected by flooding, and that figure was calculated under the old climate assumptions. The Himalayan glaciers feeding that region’s river systems are deteriorating. In just two months, May and June 2025 alone, three glacial-origin floods hit the region in Nepal, Afghanistan, and Pakistan. A three-fold increase in Glacier Lake Outburst Flood risk across the Hindu Kush Himalaya is projected by the end of the 21st century. These are floods caused not by rainfall but by the sudden collapse of ice dams holding back lakes of meltwater, sending walls of water down narrow valleys with almost no warning time.
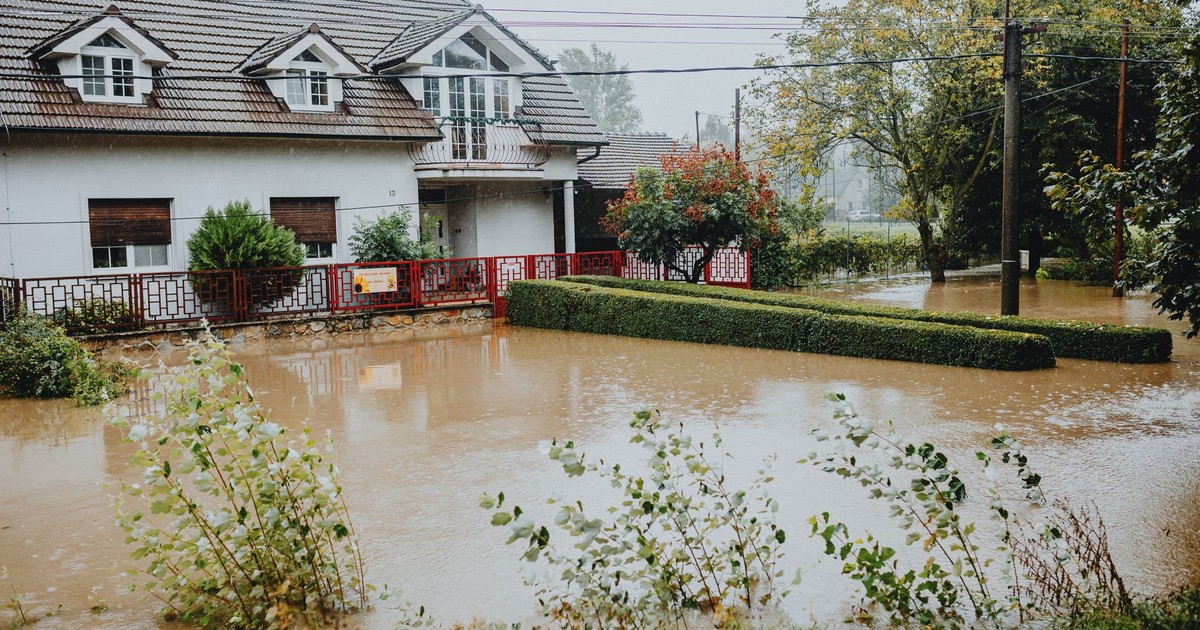
The compound risk picture in Europe is also shifting fast. The World Meteorological Organization confirmed wetter-than-normal conditions over central-western Africa, Lake Victoria, Kazakhstan and southern Russia, central Europe, Pakistan and northern India, southern Iran, and northeastern China in 2024. The July 2021 floods in Germany and Belgium, which killed more than 220 people, were not a one-off. They were a preview.
Why Mega-Flood Prediction Remains So Difficult

Part of what makes accurate mega-flood prediction hard is that the worst events sit at the outer edge of the historical record. Scientists modeling future risk can’t rely on direct observations of events that happen once per century or less. They have to use proxies: sediment layers, tree rings, geological deposits, and increasingly, climate model ensembles that simulate thousands of years of possible futures simultaneously.
The ARkStorm 2.0 research found that all of the most intense 30-day megastorm events in the climate model ensemble occurred during moderate to strong El Niño conditions, suggesting these events may exhibit some degree of predictability at a seasonal scale. That’s meaningful. It means there are atmospheric signals that could, in theory, give planners several months of warning that conditions are primed for an extreme event. What it does not give is a date.
“The USGS describes the ARkStorm as ‘perhaps inevitable,’ but there’s no way of predicting exactly when it will be until the storm starts appearing on the radar,” Swain has noted. “It could happen this year, it could happen next year, it might not happen for 50 or 60 years.” That uncertainty is not a failure of science. It’s a property of complex systems. But it creates a particular kind of political problem: it’s very hard to spend billions preparing for something that might not arrive for half a century, even when the evidence says it will eventually arrive, and arrive harder than before.
Annual average losses associated with flooding currently total $388 billion globally, according to the UN Office for Disaster Risk Reduction. That figure is calculated against historical baselines. As those baselines shift, the losses will too.
Read More: Europe’s Deadly Heat Wave: 327 Dead in Spain, Paris Bans Alcohol
The Map Is the Message

The infrastructure gap isn’t just a matter of old levees and outdated construction codes. It also runs through the maps that governments use to decide where people are allowed to build, what flood insurance costs, and what gets insured at all.
As Texas worked to recover from the deadly floods that killed more than 130 people in July 2025, those working in flood mitigation described a national system already decades behind. Federal flood maps, which indicate areas at high risk of flooding and are used to mandate flood insurance, are often outdated and not designed to provide a detailed reflection of risk. The Trump administration, experts said, had slowed progress on recent efforts to modernize FEMA’s mapping program.
When flooding from Hurricane Helene hit unmapped areas around Asheville, North Carolina in 2024, it caused a huge amount of uninsured damage to properties. The maps said those areas weren’t in danger. The water didn’t check the maps.
California’s Department of Water Resources moved in 2025 to address at least part of this, partnering with FEMA under the Cooperating Technical Partners Program to complete a flood mapping study that integrates future climate scenarios into flood inundation modeling, delivering more accurate information for communities, planners, and emergency managers. It’s a start. But it covers one river basin in one county in one state, in a country where thousands of communities are still using flood maps that predate the iPhone.
Where This Actually Leaves Us
The honest answer to the question of when the next mega-flood will hit is that nobody knows. What the science does tell us, with increasing confidence, is where it will hit hardest and why the timing will surprise people who trusted the historical record.
The Sacramento Valley, the Ganges-Brahmaputra delta, the lower Mississippi floodplain, the Rhine corridor, the mountain valleys of Nepal and Pakistan: these places share a common exposure. They sit downstream from systems that are being stressed in ways that have no precedent in the written record, built upon risk frameworks designed for a climate that has already changed.
The 200-year flood returning every 50 years isn’t a worst-case scenario anymore. It’s the middle of the range. What changes when you absorb that is how you think about the word “unprecedented” when the next disaster happens. The levees that held in 1997 and 2011 were not built for 2026 weather. The sediment records show what California’s land actually does when the atmosphere decides to wring itself out completely. The 1862 flood drowned the governor’s capital. The next one will arrive in a state with 40 million people living in the places it will go.
AI Disclaimer: This article was created with the assistance of AI tools and reviewed by a human editor.