
Meteorologists spend summer and early fall watching specific atmospheric signals that, when aligned, reliably point toward a harder, colder, stormier winter. Several of those signals are pointing in the same direction for the coming winter of 2026-2027.
Long-range winter forecasting has moved beyond folklore. Today’s meteorologists use satellite data, stratospheric wind measurements, and real-time ocean temperature records. The rough winter prediction isn’t guesswork. It’s pattern recognition, and right now the patterns are converging.
Here are the six signs meteorologists watch most closely when assessing whether a rough winter is forming.
Sign 1: El Niño and La Niña Conditions in the Pacific
The tropical Pacific Ocean functions as a master switch for winter weather patterns across North America. Sea surface temperatures running warmer or cooler than average create El Niño and La Niña cycles.
La Niña occurs when water near the equator in the Pacific Ocean is cooler than the long-term average, with that anomaly persisting for at least five consecutive overlapping three-month periods. El Niño is the reverse: warmer-than-average water in the same region.
La Niña winters typically push colder, stormier conditions into the northern tier of the United States and Canada, while El Niño winters tend to deliver wet, stormy weather into the southern U.S. and suppress snowfall across the north. Neither guarantees a brutal winter, but the ENSO signal is where seasonal forecasters start. A developing El Niño for winter 2026-2027 is already registering as one of the clearest early signals forecasters are monitoring this year.
Sign 2: A Weakening Polar Vortex
A disrupted polar vortex is the most dramatic and most consequential signal that predicts a rough winter. The polar vortex is a ring of cold, fast-spinning winds high in the stratosphere above the Arctic, normally locked in place by the temperature difference between polar and mid-latitude air. When it’s stable, it keeps Arctic cold air pinned north of the border. When it weakens, that cold air crashes south.
The polar vortex is a stratospheric feature centered over the polar regions, extending through the stratosphere up to roughly 50 km altitude, trapping cold polar air inside. A strong, stable polar vortex locks colder air into the polar regions, preventing it from spilling into lower latitudes, which creates milder winter conditions for most of the United States and Europe. When the polar vortex is disrupted or collapses, it releases cold air outward toward the mid-latitudes.
Early signs are already emerging for a potentially more disrupted polar vortex during winter 2026-2027. New long-range data shows a notable January weakening signal in the stratosphere and several major background drivers developing in ways that can increase the chance of a more dynamic winter pattern across the United States, Canada, and Europe.
A weakened polar vortex translates into temperatures that fall 30 degrees in 18 hours, burst pipes, power grid stress, and ice storms in places that haven’t seen one in a decade.
Sign 3: Low Arctic Sea Ice Extent
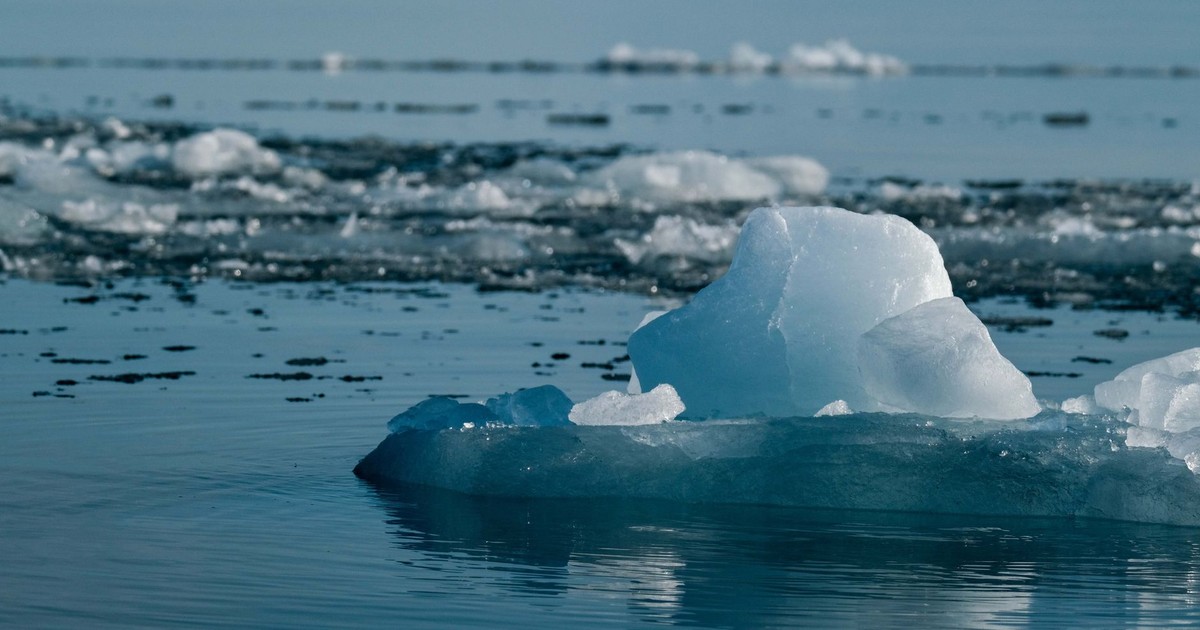
The extent of sea ice in the Arctic, particularly in the Barents and Kara seas north of Norway and Russia, drives polar vortex disruption. When sea ice in that region shrinks below normal, it changes the heat exchange between the ocean and the atmosphere in a way that sends waves of energy into the stratosphere. Those waves weaken the polar vortex.
As PBS NewsHour reported, as far back as October 2025, changes in the Arctic and low sea ice were setting up conditions for the kind of stretched polar vortex that brings severe winter weather to the U.S. Winter weather expert Judah Cohen, a visiting scientist at MIT’s Parsons Lab and Director of Seasonal Forecasting at AER, noted that heavy Siberian snowfall added to the push-and-pull of weather that warps the shape of the normally circular air pattern.
Cohen noted that dramatically low sea ice in the Barents and Kara seas helps set up a pattern of waves that end up causing cold bursts in the U.S. A warmer Arctic is causing sea ice in that region to shrink faster than other places. Low Arctic sea ice and a strong El Niño can both affect the polar vortex, raising an important merged early signal for winter 2026-2027 weather patterns across the United States, Canada, and Europe.
Sign 4: Siberian Snow Cover in October
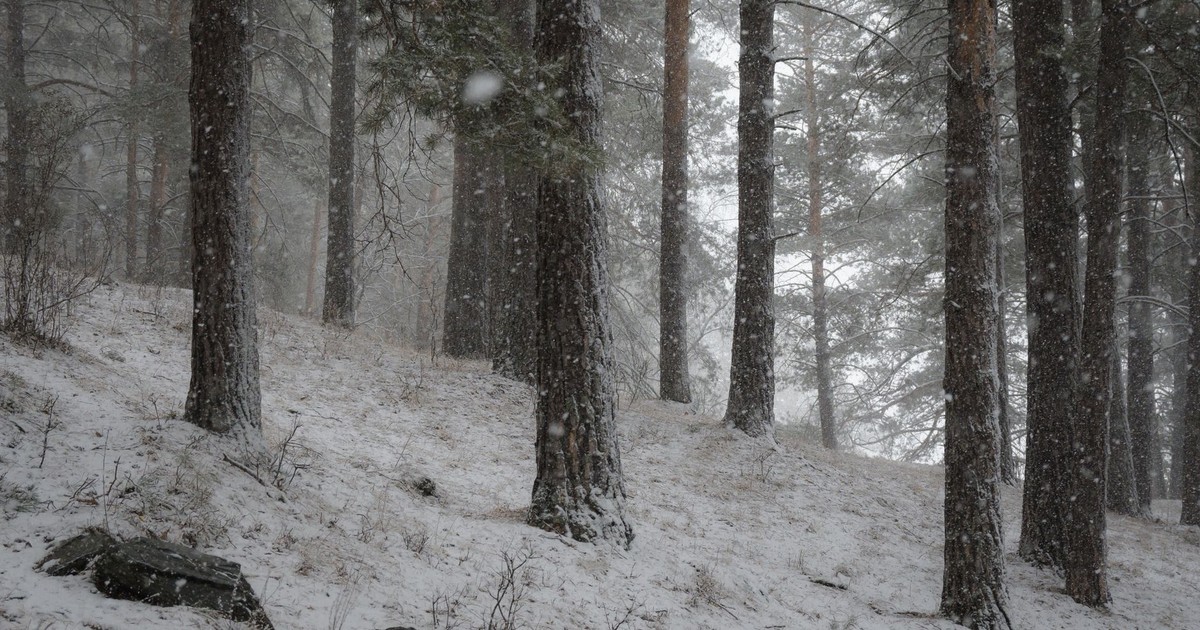
Snow falling on the plains of Siberia in October functions as a reliable leading indicator of what’s coming for North American winters. Heavy early-season snowfall over Siberia rapidly cools that vast stretch of land, which alters the pressure gradient between the cold Asian interior and the relatively warmer Arctic Ocean. That pressure gradient sends atmospheric waves upward into the stratosphere, which interfere with and can ultimately collapse the polar vortex.
The connection between heavy snow cover in Siberia in October and polar vortex disruptions has been documented to favor more frequent cold air intrusions into the Central and Eastern United States, and occasionally the Western U.S. as well.
Above-normal Siberian snow cover in October could reinforce the western ridge/eastern trough weather interface projected for a coming winter, whereas below-normal Siberian snow cover could weaken that signal. Forecasters treat this as a dial rather than a switch: more snow equals more disruption risk, less snow equals more uncertainty.
Sign 5: The Quasi-Biennial Oscillation (QBO) Phase

The QBO is the least familiar of the six signs to non-meteorologists, but it’s one of the most consistent contributors to a rough winter prediction. The Quasi-Biennial Oscillation is a cycling pattern of stratospheric winds that circle the Earth near the equator, alternating between blowing from the east (easterly phase) and from the west (westerly phase) approximately every 28 months.
When the QBO is in its easterly phase, it tends to weaken the polar vortex. An easterly QBO removes one of the polar vortex’s stabilizing influences, making it more vulnerable to disruption from other signals like sea ice loss or Siberian snow cover. A weak polar vortex means a breakdown of atmospheric circulation, and a negative, easterly QBO favors a weaker polar vortex in the stratosphere. Past winters featuring both a La Niña event and a negative, easterly QBO phase have historically produced some of the more notable cold and snowy winter patterns in the Northern Hemisphere.
An easterly QBO phase tends to favor ridge-dominant winters near the West Coast or Southwest, and trough-dominant winters across the Central and Eastern United States.
Sign 6: The Subtropical Jet Stream and Gulf Storm Track Activity
Where the polar vortex and QBO operate miles above the surface in the stratosphere, the jet stream is the river of fast-moving air in the lower atmosphere that physically steers storms across the continental United States. The position and strength of the subtropical jet stream, the one that typically flows across the southern tier of the U.S., determines whether the Gulf of Mexico becomes a conveyor belt for winter storms or stays dormant all season.
A stronger subtropical jet in a given winter means more frequent Gulf systems. Those low-pressure systems pull moisture northward from the Gulf of Mexico, and when they collide with Arctic air pushing down from Canada, the result is the kind of storm that shuts down Atlanta or buries Birmingham under a foot of ice. A developing pattern for winter 2026-2027 could bring a stronger subtropical jet, more Gulf storm systems, more East Coast storm chances, and a higher risk of snow and ice if colder air overlaps with the expected storm track.
Meteorologist Mark Gremillion, forecasting for Weatherman Plus, says early long-range weather data is pointing toward a potentially cold, stormy, and disruptive winter pattern for 2026-2027, with the strongest signal focused on the southern and eastern United States. Southern moisture delivered by a strong subtropical jet meeting Arctic air pushed southward by a disrupted polar vortex generates the kind of winter that produces insurance claims and emergency declarations.
Major seasonal forecasting models are showing unusual agreement. Direct Weather’s winter outlook of the latest guidance shows the Japanese JAMSTEC climate model, the European seasonal model, the Canadian CanSIPS, and the CFS model all point to a very wet pattern stretching from California and the Desert Southwest through the Gulf Coast and northward along the East Coast. That storm track would favor repeated low-pressure systems moving across the southern United States before strengthening along the Atlantic Coast. If enough cold air is in place, those systems could produce significant snowfall across the Ohio Valley, Mid-Atlantic, Northeast, and Great Lakes.
What the Alignment of All Six Signs Actually Means
A single rough winter prediction signal, on its own, means relatively little. One cool sign on the Pacific thermometer, or one October where Siberia happens to get an early snowfall, can happen in mild winters too. What distinguishes a genuinely serious winter forecast from routine seasonal noise is convergence: multiple signals pointing the same direction at the same time.
For the upcoming winter of 2026-2027, that convergence is striking. A developing Super El Niño, record-low Arctic sea ice, a noted polar vortex weakening signal already visible in stratospheric data in midsummer, a QBO in its easterly phase, and a storm track setup that places the subtropical jet in an active configuration are not six independent guesses. They’re six separate measurement systems, observing six different physical phenomena, all arriving at the same general conclusion.
A rapidly strengthening El Niño is forecast to continue through the Northern Hemisphere winter, and new long-range stratospheric data shows a notable polar vortex weakening signal for January and February 2027. Arctic sea ice patterns in the Barents, Kara, and Okhotsk regions are lining up in a way that can increase pressure on the polar circulation. For the United States, Canada, and Europe, this means a more volatile winter, where storm tracks, snow zones, ice risks, and sudden Arctic outbreaks may matter more than seasonal average temperatures alone.
A volatile winter isn’t necessarily a winter where it’s cold every day. It’s a winter where the swings are wider, where a 55-degree week in January can be followed by a historic ice storm in February, where the average temperature on paper looks reasonable but the individual events are severe. The January 2026 polar vortex event, the one that sent subzero temperatures across the Midwest and triggered ice events in the South, was exactly this kind of outcome. It formed from the same convergence of signals that forecasters are now reading for the season ahead.
The Honest Version of a Winter Forecast

Seasonal forecasting is not a guarantee. No one can tell you today exactly which week in January will bring the polar plunge, or precisely which cities will see the worst of the storm track. These six signs provide a probability assessment, grounded in physical science, that some winters carry more risk than others.
By this summer’s measurements, the coming winter is one of them. That doesn’t mean every region gets hammered equally, or that the forecast can’t shift as fall data comes in. The atmospheric setup heading into 2026-2027 has more signals aligned in the same direction than most years produce. A single indicator could be noise. Two could be coincidence. Six, all pointing the same way across independent measurement systems, is the kind of pattern that forecasters take seriously, and that households in the central and eastern U.S. are probably wise to pay attention to before the first hard freeze arrives.
Disclaimer: This information is not intended to be a substitute for professional medical advice, diagnosis, or treatment and is for information only. Always seek the advice of your physician or another qualified health provider with any questions about your medical condition and/or current medication. Do not disregard professional medical advice or delay seeking advice or treatment because of something you have read here.
AI Disclaimer: This article was created with the assistance of AI tools and reviewed by a human editor.