
Nobody announces a recession before it arrives. The National Bureau of Economic Research, the official body that dates U.S. economic cycles, typically declares one months after it has already started, sometimes after it has ended. By the time it’s on the front page as confirmed fact, most people have already felt it in their wallets, their job searches, and their credit card statements. The warning signs, though, do show up early. They are quieter, more technical, and easy to dismiss one at a time. Taken together, they tell a different story.
What makes the current moment worth paying attention to is that several of these signals have been flashing simultaneously. A string of troubling data points has been raising questions about whether the U.S. could be drifting toward a downturn. The economy is not in a confirmed recession as of this writing, but the indicators that have historically preceded one are stacking up in ways that are hard to ignore. Understanding what they are, and what each one looked like in practice over the last few years, is the clearest way to cut through the noise.
Here are the red flags economists and analysts watch most closely, and what they have looked like in the United States recently.
1. GDP Starts Contracting
Gross Domestic Product, GDP, is the total value of all goods and services produced in the country. When it shrinks, the economy is literally producing less. A single quarter of contraction isn’t officially a recession on its own, but it’s the first domino, and it matters enormously when the trend is moving in the wrong direction.
U.S. GDP declined at an annualized rate of 0.3% during the first quarter of 2025, the first economic contraction since the scorching inflation of 2022. That contraction was driven in large part by a 41% surge in imports, as firms scrambled to get ahead of the Trump administration’s sweeping tariff regime. It marked a sharp turn for the economy after GDP had grown at a healthy 2.4% annual rate in the final quarter of 2024.
According to a 2026 Deloitte US Economic Forecast, higher tariffs and reduced immigration will likely keep inflation elevated, and in a downside scenario the firm forecasts a technical recession beginning as early as late 2026. Economists warned that the tariffs could weaken economic growth and stoke inflation, at least in the short term. When GDP moves from healthy growth to negative in a single quarter, the “watch closely” light turns on.
2. Consumer Confidence Collapses
Consumer spending drives roughly two-thirds of the U.S. economy. When people feel uncertain about their financial future, they stop buying things they don’t absolutely need. That pullback ripples outward: fewer sales, less revenue, businesses cutting costs, jobs lost. Consumer confidence isn’t just a soft, sentimental measure. It is a leading indicator of actual spending behavior.
The Conference Board’s Expectations Index came in at 72.0 in February 2026, still below the critical threshold of 80 that has historically preceded recessions. The index had been below that level for 13 or more consecutive months as of February 2026, the longest sustained run below that threshold since the 2008 financial crisis.
University of Michigan Consumer Sentiment fell to 53.3 in March 2026, down from 56.6 in February 2026. To put that in context, the University of Michigan Consumer Sentiment has averaged 84.6 from 1952 through early 2026, meaning current readings in the mid-50s are well below historical norms. Consumer confidence dropped to recession levels in December 2025, with concern about both inflation and the labor market rising in tandem for the first time since the 1970s. When people feel that gloomy about both prices and jobs at the same time, they stop spending, and the self-fulfilling part of a recession begins.
3. Credit Card Debt Hits Record Highs
There is a difference between people spending freely because they feel financially secure and people spending on credit cards because they have no other option. The first is healthy growth. The second is a warning sign. When household debt balloons not as a choice but as a necessity, it signals that the gap between what things cost and what people actually earn has gotten too wide to bridge without borrowing.
Americans pushed credit card debt to $1.28 trillion in Q4 2025, a 5.5% annual increase, as the personal savings rate collapsed to 4.0% in Q1 2026 from 6.2% in early 2024, while housing costs and inflation eroded household purchasing power. That total is the highest balance since the New York Fed began tracking this data in 1999.
The savings rate decline is particularly telling. People are earning more in nominal terms but saving less, which means the income gains aren’t keeping pace with costs. Lower-income households under $50,000 turned net negative on their economic outlook in late 2025. These consumers are the most price-sensitive group in any market, and they are the ones most likely to change behavior when confidence drops – trading down to cheaper brands, cutting discretionary spending, and hunting harder for deals before buying. That behavioral shift shows up in retail sales figures before it shows up in GDP.
4. Delinquencies Start Rising

Credit card debt at record levels is concerning. Credit card debt that people can’t pay back is a different category of alarm. Rising delinquency rates signal that households have moved past “stretched” and into “can’t keep up.” When that pattern spreads across geographies and income levels, it tends to arrive ahead of broader economic trouble.
The share of people 30 days delinquent on their credit card debt has trended upward since the first half of 2021, with the trend being more notable in the lowest-income ZIP codes: from the second quarter of 2021 to the first quarter of 2025, their delinquency rates grew by 63% in relative terms. The present share of credit card debt in delinquency has been reaching levels seen during the 2008 global financial crisis, and the share of people in delinquency has surpassed levels from that time.
Aggregate delinquency worsened in Q4 2025, with 4.8% of outstanding debt in some stage of delinquency. Transitions into early delinquency were mixed, with mortgages and student loans increasing, while transitions into serious delinquency ticked up for credit card balances, mortgages, and student loans. The student loan delinquency rate remains elevated at 9.6% of balances that are 90 or more days delinquent. When delinquencies rise across multiple debt types simultaneously, it’s a sign that financial stress has become broad-based rather than isolated.
5. The Yield Curve Inverts
This one sounds technical, but the logic behind it is straightforward. U.S. Treasury bonds are loans people make to the government in exchange for interest. Normally, you get paid more interest for lending money for a longer time, because more can go wrong over 10 years than over 3 months. When that relationship flips, and short-term bonds pay more than long-term ones, it’s called a yield curve inversion. It means investors expect the near future to be riskier than the distant future. They are essentially betting that the economy is about to weaken.
The rule of thumb is that an inverted yield curve signals a recession in about a year, and yield curve inversions have preceded each of the last eight recessions as defined by the NBER. The 2022-2023 inversion lasted 16 months, making it the longest inversion in modern history, and despite that extended duration, no recession had materialized as of late 2025. That kept many analysts cautious about treating inversion as a guaranteed signal.
What happened next, though, renewed the concern. In February 2025, the 10-year Treasury yield fell below that of the 3-month note once again, marking an inverted yield curve that has a sterling recession prediction record. FRED data from the St. Louis Fed shows credit card delinquency rates tracked by commercial banks rising steadily through this same period, reinforcing that the yield curve signal was arriving alongside real household stress, not just financial market noise. Still, a second inversion arriving so close on the heels of the first one doesn’t make anyone feel better.
6. The Stock Market Drops Sharply
Stock markets are not the economy. A falling market doesn’t automatically mean a recession is coming, and a booming market doesn’t mean everything is fine. But sharp, sustained declines do tend to reflect what investors collectively believe is ahead, and when that pessimism is broad-based and sustained, it often becomes a self-reinforcing drag on business confidence, household wealth, and corporate investment.
The stock market dropped sharply in early 2025, and consumer confidence tumbled to its lowest level since the onset of the COVID-19 pandemic. Following a 57.8% total return over the prior two years, which marked its best two-year performance since 1998, the S&P 500 corrected more than 10% in the latter half of Q1 2025, leading to its worst quarterly performance since the peak of the rate-hiking cycle in Q3 2022.
As of late April 2025, the S&P 500 was down 7.3% since Inauguration Day, while the tech-heavy Nasdaq was down 11%, the market’s worst performance at the start of a new presidency since the 1970s. History gives a clear frame of reference: the S&P 500 has declined by an average of 31% during recessions. Drops of the scale seen in early 2025 don’t guarantee a recession, but they do signal that the people with the most at stake in getting the future right were not feeling optimistic.
7. The Labor Market Starts Cooling
Low unemployment is often cited as a reason not to worry about a recession. And it’s true that a 4% unemployment rate looks nothing like the 10% seen during the aftermath of the 2008 financial crisis. But watching the overall rate misses how quickly the direction can change. Economists pay close attention to the pace of hiring, the number of job openings, and how long it takes people to find work once they’ve lost a job. Those leading indicators often shift before the unemployment headline rate moves at all.
The U.S. labor market entered 2026 relatively weak, with average monthly nonfarm payroll gains standing at just 14,000 during the six months to January, far below the average gain of 122,000 recorded in 2024. Hiring slowed throughout 2025, with the U.S. unemployment rate rising to 4.6% in November, its highest level in four years. Layoffs jumped to 1.1 million through November, up 54% from a year earlier and the highest level since 2020.
Small businesses were broadly pessimistic about how they would fare in 2026. A Newsweek report from March 2026 noted that the Small Business Credit Survey found the share of small businesses anticipating revenue growth dropped to its lowest level since 2020, as expectations for employment growth sank to multi-year lows. More firms also reported difficulty reaching their customers, as well as challenges from higher input costs and uncertainty surrounding tariffs and interest rates. Small businesses employ roughly half of the American workforce. When they stop hiring and start pulling back, the ripple effect on employment is significant.
8. Tariff Shock and Trade Policy Uncertainty
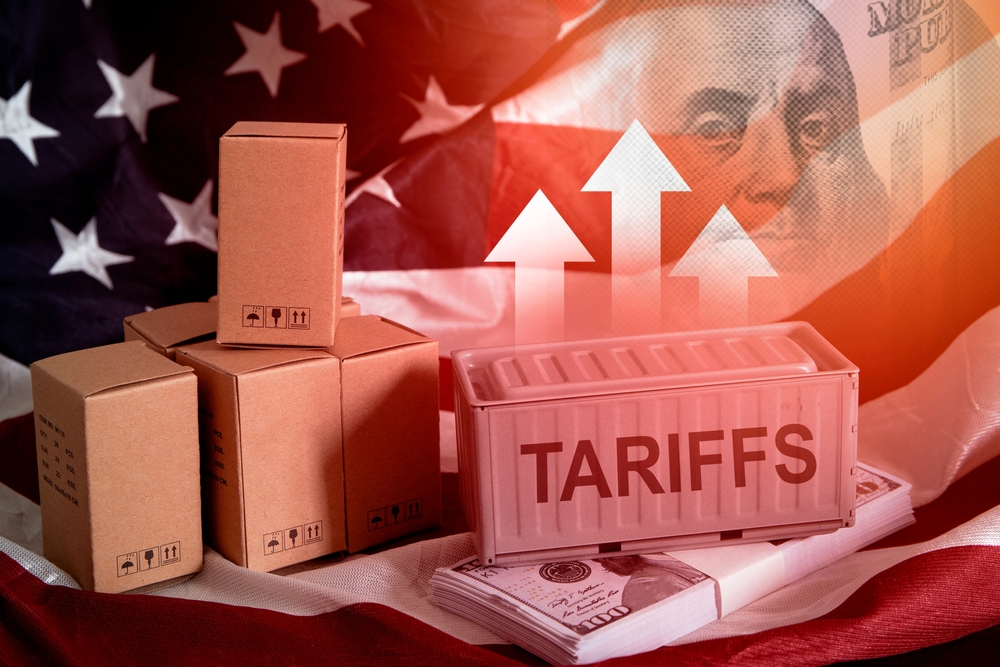
Recessions don’t always grow from gradual deterioration. Sometimes a single policy shock disrupts enough supply chains, raises enough costs, and rattles enough confidence all at once to tip an already-slowing economy over the edge. Trade policy is one of the few levers capable of doing exactly that, because it affects not just the price of goods but the planning horizon of every business that imports materials, sells internationally, or competes with foreign producers.
The so-called “Liberation Day” tariff duties represent the single largest tariff hike in history and raised the average tax on U.S. imports to its highest level in more than 100 years. Trump imposed 10% taxes on nearly everything the United States imports, along with tariffs of 145% on many goods from China, then called for additional tariffs, only to suspend some of them, leaving businesses and consumers uncertain about what import taxes would look like in the future.
That uncertainty alone functions as a tax on decision-making. Companies delay investment. Consumers delay major purchases. Supply chains reroute at cost. When businesses can’t plan twelve months ahead because the rules might change next week, growth stalls not from what has happened but from what might.
What to Do With All of This
None of these eight signals, standing alone, confirms that a recession is imminent. Economists have been warning about some of them for years. The yield curve inverted in 2022 and the predicted recession never arrived on schedule. Consumer confidence dropped and then partially recovered. The economy has proven more durable than many forecasts suggested. That track record matters.
But the difference between watching one warning light and watching eight at once is real. Recession probability estimates in early 2026 ranged from around 25% according to Goldman Sachs to 42% according to Moody’s Analytics. Those aren’t certainties, but they aren’t background noise either. Moody’s chief economist Mark Zandi put it plainly: the economy can probably get through 2026 without a downturn, but “nothing else can go wrong.” That’s not exactly a reassuring margin of safety.
What’s worth taking away from all of this is not panic but preparation. The people who navigate economic downturns best are not the ones who predicted them correctly. They are the ones who had already looked at their credit card balances, their savings rate, their job security, and their exposure to market volatility before the headline arrived. The signals above are, if nothing else, a reasonable prompt to do that accounting now, while the information is still just a warning and not a consequence. Check your emergency fund. Know your monthly fixed costs. Understand which parts of your income are variable. Those are actions you can take today regardless of what the next GDP print says.
AI Disclaimer: This article was created with the assistance of AI tools and reviewed by a human editor.